If you’re building apps or maintaining a platform running hundreds of apps across your enterprise, you might have run into a similar situation: something small breaks, performance tanks, or a user hits a weird and hard-to-reproduce bug. So you need to chase logs, check version mismatches, and guess at backend timings. Or you may just want to monitor and observe how your apps are doing inside the platform.
That’s where io.Insights comes in, giving you observability into what’s actually happening inside the io.Connect platform, your apps, and everything running on top of them.
What is io.Insights?
Io.Insights is an observability extension built specifically for the io.Connect ecosystem. It captures telemetry (traces, metrics, and logs) from desktop or browser-based apps, APIs, io.Manager, and the platform itself. And it does this with very little extra setup required.
In practice, that means you get clear, structured answers to questions like:
- Why did this specific operation fail for this specific user?
- What apps are being used the most, by start count, by session time, or by role?
- When during the day do most errors happen and who’s hitting them?
- What’s the latency of backend requests in real workflows?
- Are end-user machines hitting CPU or memory limits?
This kind of telemetry isn’t just about performance monitoring. It’s the foundation for debugging production issues, making smart product decisions, and understanding platform-wide usage patterns.
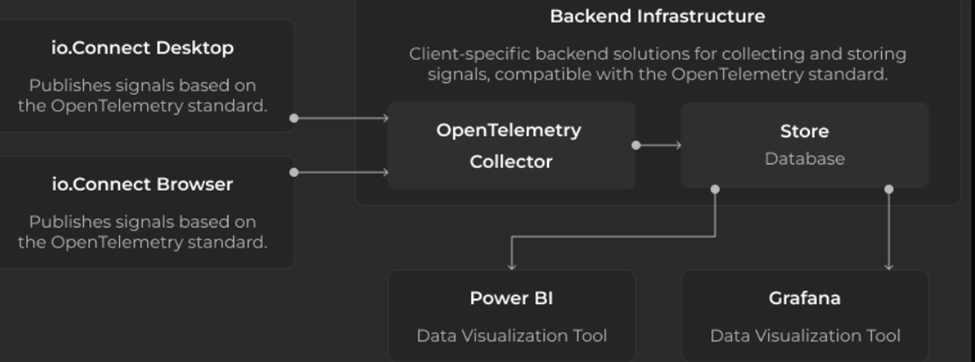
How does io.Insights work?
io.Insights is based on the OpenTelemetry (OTEL) standard. That means everything it captures, like traces, metrics, or logs is structured, vendor-neutral, and works out of the box with tools like:
- Grafana
- Prometheus
- Jaeger
- Splunk
- Power BI
Because it’s OTEL-compliant, you’re not locked into any specific vendor, and you can ingest the data however and wherever you want, locally, in the cloud, or straight into your existing dashboards.
Once io.Connect is installed with Insights enabled and the OTEL Collector is configured to handle the data pipeline telemetry will roll. No major code changes are needed to start capturing info.
What does it track?
io.Insights publishes:
- Platform and API metrics: startup counts, usage, memory/CPU profiles, session durations
- Traces from user actions and platform operations (like context updates or adapter calls)
- Logs from the io.Connect platform and from your own applications if you opt in
Why OpenTelemetry?
OpenTelemetry has been adopted by observability vendors and enterprises as the de facto standard for instrumenting cloud-native applications, upon which the entire observability ecosystem builds. According to recent surveys, 48.5% of organizations are already using OpenTelemetry, with another 25.3% planning implementation soon. The framework has become the second-largest Cloud Native Computing Foundation (CNCF) project by number of contributors, sitting just behind Kubernetes.
One of OpenTelemetry’s most compelling advantages is its vendor-neutral approach that breaks free from proprietary vendor agents. By using OpenTelemetry SDKs, organizations can change observability vendors as simply as changing configuration for exporters
Key OTEL Terms to understand
OpenTelemetry offers several types of data
- Trace: A full end-to-end sequence of operations, e.g. user selects a client, which triggers a context update, which triggers a backend fetch.
- Span: A single step or operation inside a trace. Spans are hierarchical and connected, showing timing, duration, and relationships. Think of them as nodes in a tree.
- Metric: A numerical data point over time. For example, CPU usage, request counts, or session duration.
- Log: An event-level message, often tied to a span. Includes error details, stack traces, or any structured message your app emits.
What can you do with this data?
Here are a few questions you can answer using io.Insights:
Usage & Behavior
- What applications are used most? By start count or by how long they’re in focus?
- How frequently do users switch between apps or workspaces?
- What’s the average session length by app or user?
- What departments or roles rely most on which tools?
Troubleshooting
- Which actions are error-prone and for who?
- Are performance issues tied to specific machines or network latency?
- Is a failing adapter being called more often than expected?
- When something breaks, what happened before and after?
System Health
- How much CPU/memory is being used by Connect apps on user machines?
- Are certain machines regularly hitting system limits?
- Are backend services responding consistently across users?
All of this is driven by the instruments that come built-in and it can be extended with your own events, metrics, or log data using simple APIs.
What do you need to run it?
Here’s what the setup typically looks like:
- Install io.Connect with Insights enabled.
- Set up a local or remote OTEL collector (e.g. with Docker).
- Configure io.Connect to send telemetry to the collector.
- Connect your collector to your analytics or dashboard backend.
That’s it, you’re now streaming metrics, logs, and traces out of your platform, ready for analysis. Of course, the config could be fetched from io.Manager, using its remote configuration feature
Sample Setup
Visualizing metrics with Grafana
Grafana is a powerful platform that can be used to visualize metrics, traces and logs all in one place. This makes it convenient to jump for example, from a spike in a particular metric to the relevant traces with the same labels/time window. The dashboards, graph metrics and overlay annotations help track cause → effect and link to logs or trace details. It also offers additional features like alerting, multi-channel notifications, and a library of community dashboards and plugins.
How to set up Grafana?
Grafana is offered as Grafana Cloud and an open-source download. If you want to keep your data local go with the downloads, it’s super straightforward. Simply visit Download Grafana | Grafana Labs , if you are a Windows user, select Windows and download the Standalone Windows Binaries zip → right-click and select the unblock checkbox, and click OK, now unzip the archive to your preferred location. In that folder, open /bin and run grafana-server.exe, which will start Grafana. Now you can open a browser and enter http://localhost:3000/ (or replace the port if preferred).
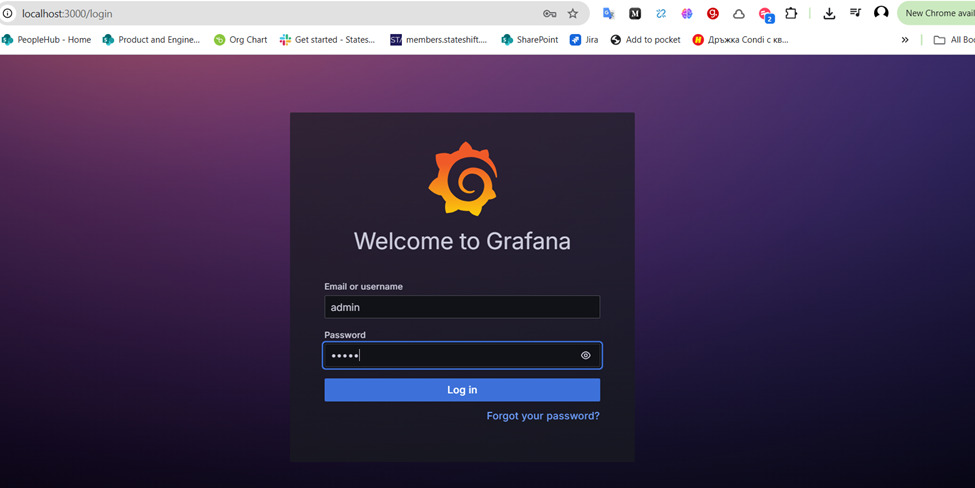
Default login credentials are admin/admin (make sure to change your password and keep it safe). That’s it you can now play around.
In the left-hand sidebar select Connections → Data Sources, click + Add new data source and select Prometheus.
Why do I need Prometheus?
Grafana is your cockpit used to visualize the dashboard, but the downloadable version doesn’t keep metrics on disk. You still need a database that will store every sample, answer queries, and expose an HTTP API. Prometheus fills that role.
Grafana ships “native support for Prometheus”, so you can point it at a running Prometheus and it can query with PromQL.
Prometheus can be downloaded from Download | Prometheus and configured via prometheus.yml following the steps here First steps with Prometheus | Prometheus . By default Prometheus runs on localhost:9090.
Prometheus config (scrape the Collector)
Add a scrape job to your prometheus.yml:
scrape_configs:
  - job_name: 'otel-collector'
    static_configs:
      - targets: ['localhost:9464']   # default Prometheus exporter endpoint
Prometheus will now scrape all metrics the collector exposes (including metrics your apps send via OTLP that the collector converts to Prometheus format).
Can I skip Prometheus?
There are several alternatives that play well with Grafana
- Grafana Agent / Alloy - embeds a cut‑down Prometheus engine
- Grafana Cloud or Mimir – easiest to set up, but runs remotely
- Other TSDBs ― InfluxDB, VictoriaMetrics, TimescaleDB, etc.
Visualize traces in Grafana to combine the power of metrics and traces
To visualize traces in Grafana, you’ll need a tracing backend since Prometheus is designed specifically for metrics. One of the easiest ways is to use Jaeger or Grafana’s own Tempo.
Why Jaeger or Tempo?
Grafana natively supports both Jaeger and Tempo data sources. They’re optimized specifically for handling distributed traces, allowing you to quickly navigate from high-level metrics down into detailed operation-level data.
Setting Up Jaeger
Jaeger is an open-source tracing system, straightforward to install locally:
- Download the latest Jaeger Windows binary from Jaeger releases.
- Unzip the package into a folder like C:\Jaeger.
- Open PowerShell and run:
cd C:\Jaeger
.\jaeger-all-in-one.exe --collector.otlp.enabled=true --collector.otlp.http.host-port=:4318
This command starts Jaeger with OTLP support. It will listen for traces sent to http://localhost:4318/v1/traces, and expose a web UI at http://localhost:16686. Typical ports are:
- Thrift HTTP ingest: http://localhost:14268/api/traces
- gRPC ingest: localhost:14250
Connecting Jaeger to Grafana
Follow the setup guide from Grafana here - Jaeger data source | Grafana documentation
OpenTelemetry Collector config
Here’s a sample for pointing an OTEL collector to Prometheus and Jaeger running locally:
- Apps send OTLP → Collector (:4317 gRPC / :4318 HTTP).
- Collector serves metrics at :8889/metrics.
- Collector sends traces to Jaeger.
receivers:
  otlp:
    protocols:
      grpc:        # default port 4317
      http:        # default port 4318

processors:
  batch: {}

exporters:
  # Prometheus: expose /metrics that Prometheus will scrape
  prometheus:
    endpoint: "0.0.0.0:8889"   # collector will serve metrics here
    namespace: "otelcol"

  # --- Choose ONE of the Jaeger options below ---

  # Option A (most universal): Jaeger Thrift over HTTP (Jaeger all-in-one/collector default)
  jaeger:
    endpoint: "http://localhost:14268/api/traces"
    tls:
      insecure: true

  # Option B (if your Jaeger exposes native OTLP 4317/4318 — newer Jaeger versions)
  # otlp/jaeger:
  #   endpoint: "http://localhost:4318"   # or "localhost:4317" for gRPC
  #   # For HTTP:
  #   tls:
  #     insecure: true
  #   # For HTTP, set explicit protocol:
  #   # If your collector version needs it:
  #   # headers: {}
  #   # compression: none

service:
  pipelines:
    metrics:
      receivers: [otlp]
      processors: [batch]
      exporters: [prometheus]
    traces:
      receivers: [otlp]
      processors: [batch]
      exporters: [jaeger]        # or [otlp/jaeger] if you chose Option B
Read next
In the next article, we walk through a problem one of our users reported and show how you can track the issue all the way down to the backend service much faster than before.
Useful links
- io.Insights Documentation
- Track down issues fast with io.Insights
- Answering Questions with io.Insights Metrics and Grafana